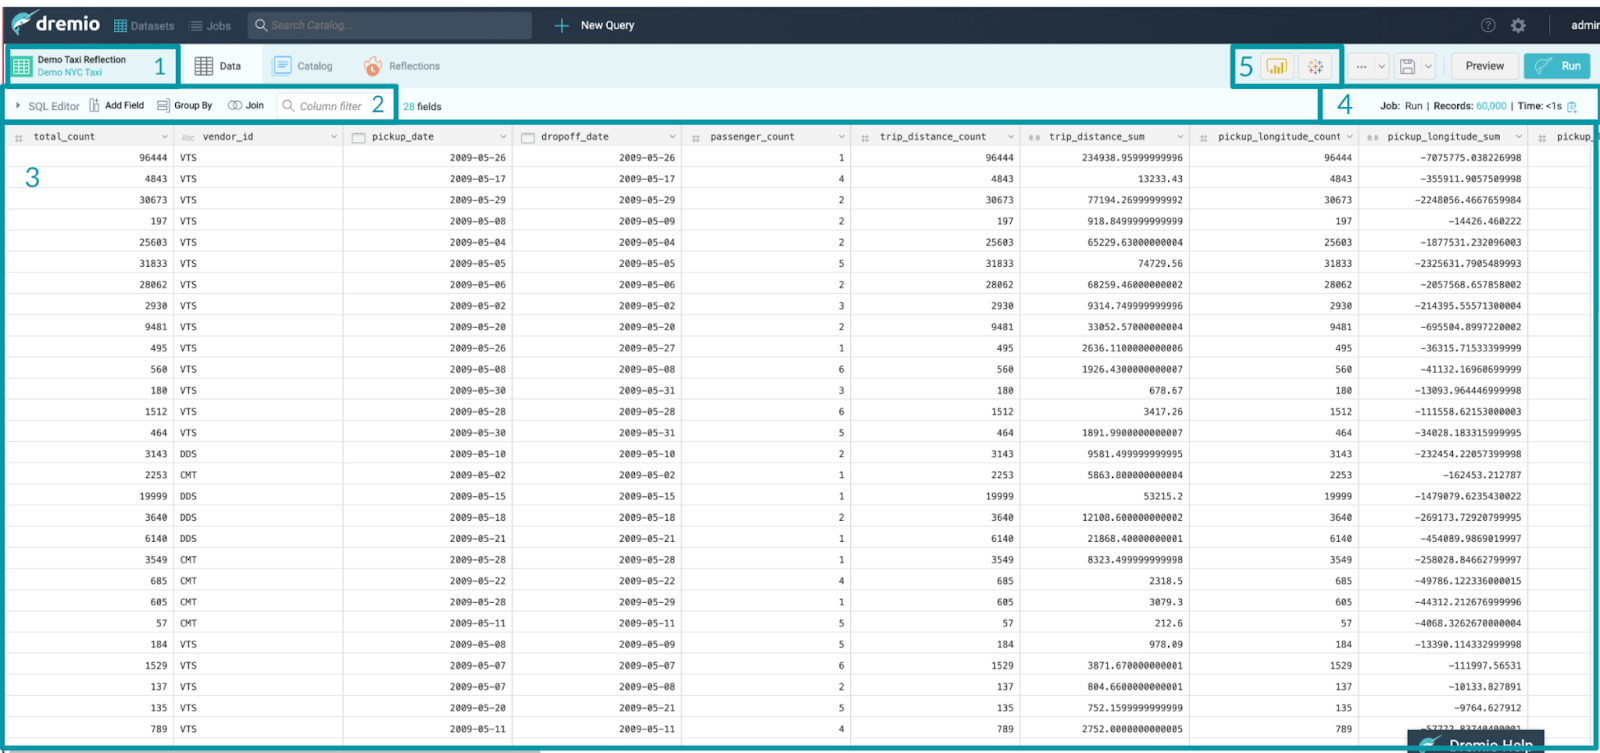
Now that we have selected a dataset to explore, let’s take a look at the different aspects of the Data Preview screen
-
5 regions in the image are described below:
- Shows the dataset that is being used
- Dremio provides the ability to write specific SQL functions, add or remove columns and join datasets. We will explore this in greater detail later in the workshop.
- Is the preview window to the current dataset and the fields that the dataset contains. Depending on the size of the dataset, this might only be a sample of the entire dataset that Dremio will query
- Shows the number of records in the preview and the query response time
- Dremio can connect to a variety of the most popular BI and Data Science tools. Users can create a direct connection directly from the Dremio UI to Tableau and PowerBI
- Next to SQL Editor, click the arrow head icon to expand the SQL Editor. What do you see in the SQL Editor space? SELECT * FROM "Demo Taxi Reflection"
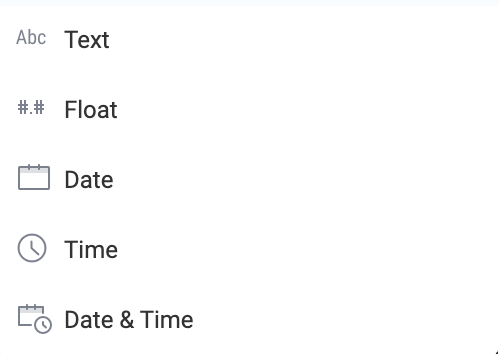
- Explore the different fields in this dataset. You will notice that Dremio has applied a Data Type to each field. Here are the different Data Types:
- Using the SQL Editor, count the number of records that are in this table by entering SELECT COUNT(*) FROM "Demo Taxi Reflection". How many records are in this table? 492,111
- Return to the Dremio Home Screen by clicking the Dremio Logo in the top left corner of your screen. It will ask you if you want to leave or save your changes, click “Leave”