Dremio Workshop > Exploring the Dataset in Tableau > Reviewing count of records by Date
- Navigate back to your Tableau Online Workbook which should still show the count of NYC_Taxi records.
- Count the records by pickup date by dragging the pickup_date dimension to the column bar. Tableau is now showing the count of records for each year in the dataset.
- Let’s get a little more granular with the data by examining the data by month. Hover over the blue YEAR(pickup_date) and click the dropdown arrow. Tableau provides many different options for how to represent that data. Click on the first Month option on the list

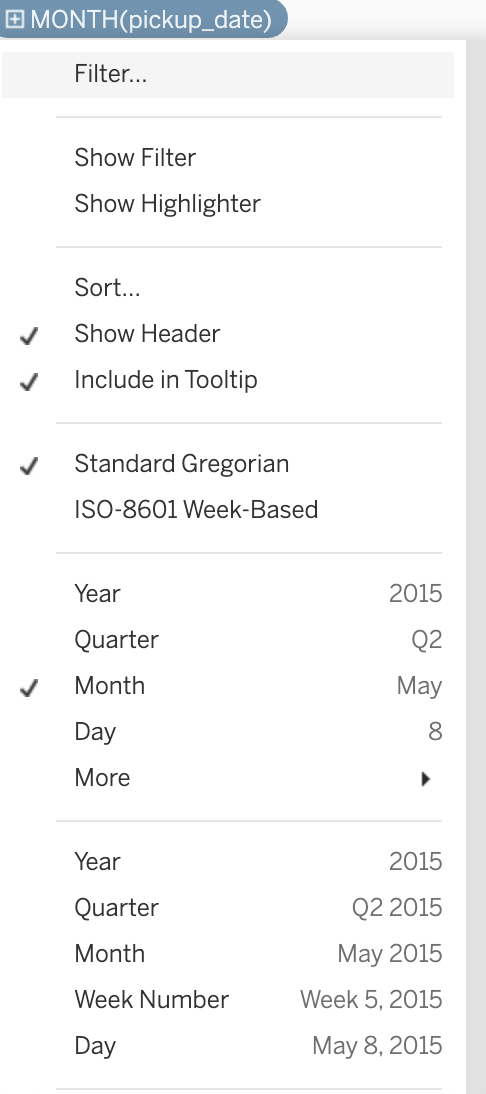 Tableau is now showing the data that is grouped based on the month of the record. This is interesting in showing Taxi usage each month but does not show any relational analysis like month over month. To do this, Hover over the blue YEAR(pickup_date) and click the dropdown arrow. Click the second month option that has the Month & Year listed and notice the difference.
 Count by Month
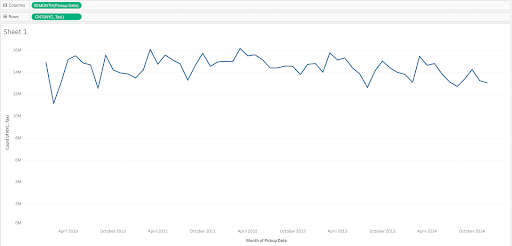 Count Month over Month